
")
United States E-Commerce Payment Market Forecast 2023-2028, Industry Trends, Share, Growth, Impact of Inflation, Opportunity Company Analysis
United States E-Commerce Payment Market Outlook
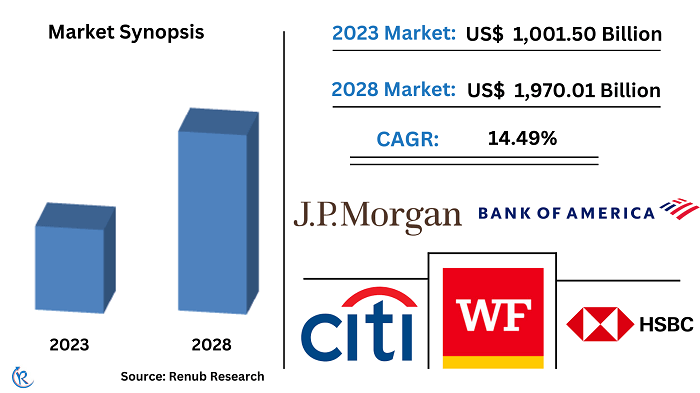
United States E-commerce Payment Market is expected to grow to US$ 1,970.01 Billion in 2028, according to Renub Research. The United States is a developed economy with the world's largest GDP. It has the second-largest online purchasing power behind China. The United States remains a world leader in E-commerce due to its historical strength in financial services, information technology, telecommunications, and transportation, as well as the vast size, diversity, and dynamism of the U.S. economy.
Shopping through a mobile device has become common among the United States' online population. According to our research findings, mobile apps are the leading channel for online grocery shopping, with nearly 80 percent of shoppers making purchases through apps in 2021. In addition, the average value of U.S. online shopping orders is generally higher on desktop than mobile devices. As a result, mobile commerce is fast becoming consumers' preferred shopping channel. However, the Daily use of apps for an online shop is getting more decisive year after year, with app-based sales accounting for more than half of all mobile e-commerce transactions.
USA's E-commerce Payment Market is projected to grow at a CAGR of 14.49% from 2023-2028.
Over the past years, the United States fastest-growing categories for e-commerce sales were Travel, Consumers Electronic, Clothes and Apparel, Household goods, Health and Beauty, and Others. Groceries & Household goods cumulatively grew more sales than since 2021. In addition, food and beverage e-commerce grew 170%; more Americans are heading towards websites to place grocery orders in 2021, according to Renub Research. However, apparel was one of the categories of e-commerce to grow slower than the other industry average.
Online Users and Penetration have stabilized in the last few years
Historically, digital's share of retail sales through all channels has grown incrementally. Penetration numbers increased as consumers became more comfortable making purchases online and retailers improved their fulfillment operations. Among the most prominent online markets, the United States placed third with over 307 million internet users nationwide in 2022. The United States is the global home of technological innovation and the home hub of the world's internet companies. More than 90 percent of people have access to the internet in the U.S., and many people can no longer imagine a life without the internet.
Payment Method Analysis
Over the past decades, USA Cards Online payment methods have been dominant and used for all e-commerce transactions since 2020. The success of online payments can be seen as regards longstanding familiarity with the payment method. Credit and debit card penetration in the USA is among the highest globally. In addition, the ubiquity of cards (debit & credit) has made them more enablers of digital wallets with smartphones in the U.S. Cards can potentially extend the benefits by seamlessly integrating personalized financing offers and loyalty programs.
Payments through a generational lens, digital Americans that have grown up with access to high-speed internet and smartphones seem to have the highest comfort level with setting up and regularly using card-enabled digital wallets. In addition, it appears that U.S. people are adapting to the new landscape, with over half of merchants likely to accept digital wallet payments within the next few years, including popular digital wallet providers like Apple Pay, PayPal, and Google Pay.
The shifting in the digital landscape and online transaction dynamics remain keen to drive the E-commerce payment market in the United States. At the same time, ensuring listed items are in stock and cyber security threats continue to evolve rapidly and will Challenge market growth. As per per research finding, the United States E-commerce Payment Industry will be US$ 875.20 Billion in 2022.
Company Performance
In 2021, Walmart topped the ranking of shopping apps with the most active monthly users, while Second place went to Amazon's app, with a monthly mobile audience of 98 million. Amazon takes up the majority of the U.S. e-commerce market, and it is worth noting that its market share is gradually declining. This may mean that there is scope for smaller brands to stake their claim on the U.S. market, although the safest option is still to join the mega-platform as a seller and take advantage of its reach and infrastructure.
Renub Research report titled “United States Ecommerce Payment Market & Forecast, by Category (Travel, Consumers Electronic, Clothes and Apparel, Household goods, Health and Beauty, Groceries and Others), Payment Method Market (Bank Transfer, Card, Digital Wallets, Cash and Others), Digital Wallets (PayPal, Amazon Pay, Xero and Stripe), Bank (JP Morgan, Bank of America, Wells Fargo, HSBC Holdings plc’s and Citi Group)” studies the United States ecommerce payment market. This report provides an all-encompassing analysis of the key growth drivers and restraining factors, demand, and their projections for the upcoming years.
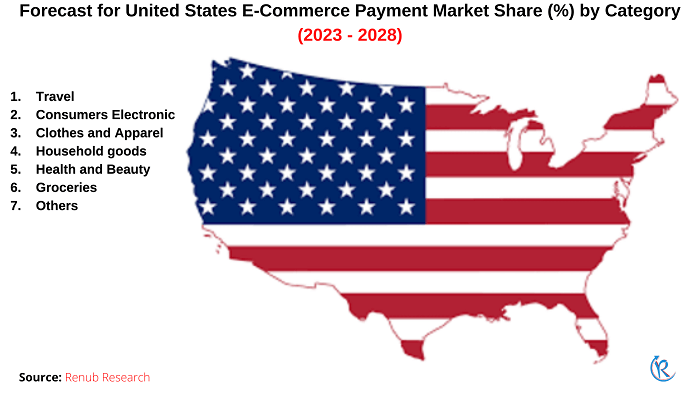
Category - United States E-Commerce Payment Market
1. Travel
2. Consumers Electronic
3. Clothes and Apparel
4. Household goods
5. Health and Beauty
6. Groceries
7. Others
Payment Method - United States E-Commerce Payment Market
1. Bank Transfer
2. Card (Credit and Debit)
3. Digital Wallets
4. Cash
5. Others
Digital Wallet - United States E-Commerce Payment Market
1. PayPal
2. Amazon Pay
3. Xero
4. Stripe
Bank - United States E-Commerce Payment Market
1. JP Morgan
2. Bank of America
3. Wells Fargo
4. HSBC Holdings plc’s
5. Citi Group
Report Details:
| Report Features | Details |
| Base Year | 2022 |
| Historical Period | 2018 - 2022 |
| Forecast Period | 2023 - 2028 |
| Market | US$ Billion |
| Segment Covered | Category, Payment Method, Digital Wallet, Bank |
| Bank Covered | JP Morgan, Bank of America, Wells Fargo, HSBC Holdings plc’s and Citi Group |
| Customization Scope | 20% Free Customization |
| Post-Sale Analyst Support | 1 Year (52 Weeks) |
| Delivery Format |
PDF and Excel through Email (We can also provide the editable version of the report in PPT/Word format on request) |
1. Introduction
2. Research Methodology
3. Executive Summary
4. Market Dynamics
4.1 Growth Drivers
4.2 Challenges
5. United States E-Commerce Payment Market
6. Market Share – US E-Commerce Payment Analysis
6.1 By Category
7. Category Market Analysis – US E-Commerce Payment
7.1 Travel Market
7.2 Consumer Electronics Market
7.3 Clothing, Apparel and Accessories Market
7.4 Household Goods Market
7.5 Health and Beauty Market
7.6 Groceries Market
7.7 Others Market
8. Payment Method Market
8.1 Credit Card
8.2 Digital/Mobile Wallet
8.3 Debit Card
8.4 Charge & Deferred Debit Card
8.5 Bank Transfer
8.6 Cash on Delivery
8.7 Buy Now Pay Later
8.8 Others
9. Digital Wallets
9.1 PayPal Holdings
9.1.1 Overview
9.1.2 Recent Development
9.1.3 Revenue
9.2 Amazon Pay
9.2.1 Overview
9.2.2 Recent Development
9.2.3 Revenue
9.3 Xero
9.3.1 Overview
9.3.2 Recent Development
9.3.3 Revenue
10. Bank Analysis
10.1 JPMorgan Chase Bank
10.1.1 Overview
10.1.2 Recent Development
10.1.3 Revenue
10.2 Bank of America
10.2.1 Overview
10.2.2 Recent Development
10.2.3 Revenue
10.3 Wells Fargo
10.3.1 Overview
10.3.2 Recent Development
10.3.3 Revenue
10.4 HSBC Holdings plc’s
10.4.1 Overview
10.4.2 Recent Development
10.4.3 Revenue
10.5 Citi Group
10.5.1 Overview
10.5.2 Recent Development
10.5.3 Revenue
List of Figures:
Figure-01: United States E-Commerce Payment Market (Billion US$), 2018 – 2022
Figure-02: Forecast for – United States E-Commerce Payment Market (Billion US$), 2023 – 2028
Figure-03: Category – Travel Market (Billion US$), 2018 – 2022
Figure-04: Category – Forecast for Travel Market (Billion US$), 2023 – 2028
Figure-05: Category – Consumer Electronics Market (Billion US$), 2018 – 2022
Figure-06: Category – Forecast for Consumer Electronics Market (Billion US$), 2023 – 2028
Figure-07: Category – Clothing, Apparel and Accessories Market (Billion US$), 2018 – 2022
Figure-08: Category – Forecast for Clothing, Apparel and Accessories Market (Billion US$), 2023 – 2028
Figure-09: Category – Household Goods Market (Billion US$), 2018 – 2022
Figure-10: Category – Forecast for Household Goods Market (Billion US$), 2023 – 2028
Figure-11: Category – Health and Beauty Market (Billion US$), 2018 – 2022
Figure-12: Category – Forecast for Health and Beauty Market (Billion US$), 2023 – 2028
Figure-13: Category – Groceries Market (Billion US$), 2018 – 2022
Figure-14: Category – Forecast for Groceries Market (Billion US$), 2023 – 2028
Figure-15: Category – Others Market (Billion US$), 2018 – 2022
Figure-16: Category – Forecast for Others Market (Billion US$), 2023 – 2028
Figure-17: Payment Method – Credit Card Market (Billion US$), 2018 – 2022
Figure-18: Payment Method – Forecast for Credit Card Market (Billion US$), 2023 – 2028
Figure-19: Payment Method – Digital/Mobile Wallet Market (Billion US$), 2018 – 2022
Figure-20: Payment Method – Forecast for Digital/Mobile Wallet Market (Billion US$), 2023 – 2028
Figure-21: Payment Method – Debit Card Market (Billion US$), 2018 – 2022
Figure-22: Payment Method – Forecast for Debit Card Market (Billion US$), 2023 – 2028
Figure-23: Payment Method – Charge & Deferred Debit Card Market (Billion US$), 2018 – 2022
Figure-24: Payment Method – Forecast for Charge & Deferred Debit Card Market (Billion US$), 2023 – 2028
Figure-25: Payment Method – Bank Transfer Market (Billion US$), 2018 – 2022
Figure-26: Payment Method – Forecast for Bank Transfer Market (Billion US$), 2023 – 2028
Figure-27: Payment Method – Cash on Delivery Market (Billion US$), 2018 – 2022
Figure-28: Payment Method – Forecast for Cash on Delivery Market (Billion US$), 2023 – 2028
Figure-29: Payment Method – Buy Now Pay Later Market (Billion US$), 2018 – 2022
Figure-30: Payment Method – Forecast for Buy Now Pay Later Market (Billion US$), 2023 – 2028
Figure-31: Payment Method – Others Market (Billion US$), 2018 – 2022
Figure-32: Payment Method – Forecast for Others Market (Billion US$), 2023 – 2028
Figure-33: Digital Wallets – PayPal Holdings Market (Billion US$), 2018 – 2022
Figure-34: Digital Wallets – Forecast for PayPal Holdings Market (Billion US$), 2023 – 2028
Figure-35: Digital Wallets – Amazon Pay Market (Billion US$), 2018 – 2022
Figure-36: Digital Wallets – Forecast for Amazon Pay Market (Billion US$), 2023 – 2028
Figure-37: Digital Wallets – Xero Market (Million US$), 2018 – 2022
Figure-38: Digital Wallets – Forecast for Xero Market (Million US$), 2023 – 2028
Figure-39: JPMorgan Chase Bank – Global Revenue (Billion US$), 2018 – 2022
Figure-40: JPMorgan Chase Bank – Forecast for Global Revenue (Billion US$), 2023 – 2028
Figure-41: Bank of America – Global Revenue (Billion US$), 2018 – 2022
Figure-42: Bank of America – Forecast for Global Revenue (Billion US$), 2023 – 2028
Figure-43: Wells Fargo – Global Revenue (Billion US$), 2018 – 2022
Figure-44: Wells Fargo – Forecast for Global Revenue (Billion US$), 2023 – 2028
Figure-45: HSBC Holdings plc’s – Global Revenue (Billion US$), 2018 – 2022
Figure-46: HSBC Holdings plc’s – Forecast for Global Revenue (Billion US$), 2023 – 2028
Figure-47: Citi Group – Global Revenue (Billion US$), 2018 – 2022
Figure-48: Citi Group – Forecast for Global Revenue (Billion US$), 2023 – 2028
List of Tables:
Table-01: United States E-Commerce Payment Market Share by Category (Percent), 2017 – 2022
Table-02: Forecast for – United States E-Commerce Payment Market Share by Category (Percent), 2023 – 2028
Reach out to us
Call us on
USA: +1-678-302-0700
INDIA: +91-120-421-9822
Drop us an email at
info@renub.com